Executive synopsis - August 2026
The market data points to a more inventory-rich and slower-moving residential market, but not one experiencing a broad collapse in prices or transaction activity. By August 2026, active inventory reached the highest level in the 12-month history provided, the absorption rate increased, and properties were taking materially longer to sell than one year earlier. At the same time, year-to-date sold volume remained slightly ahead of 2025, pending activity was higher, and average sale price remained modestly positive year over year. The central story is therefore greater buyer choice and increased seller competition, accompanied by relatively stable pricing and cumulative transaction volume.
The practical implication is that seller success will increasingly depend on accurate initial pricing, presentation, responsiveness to early market feedback, and realistic expectations about time on market. Buyers have more alternatives and slightly more negotiating room than they did during the spring, but the 96.2% sale-to-original-list-price ratio does not indicate indiscriminate discounting across the entire market.
-
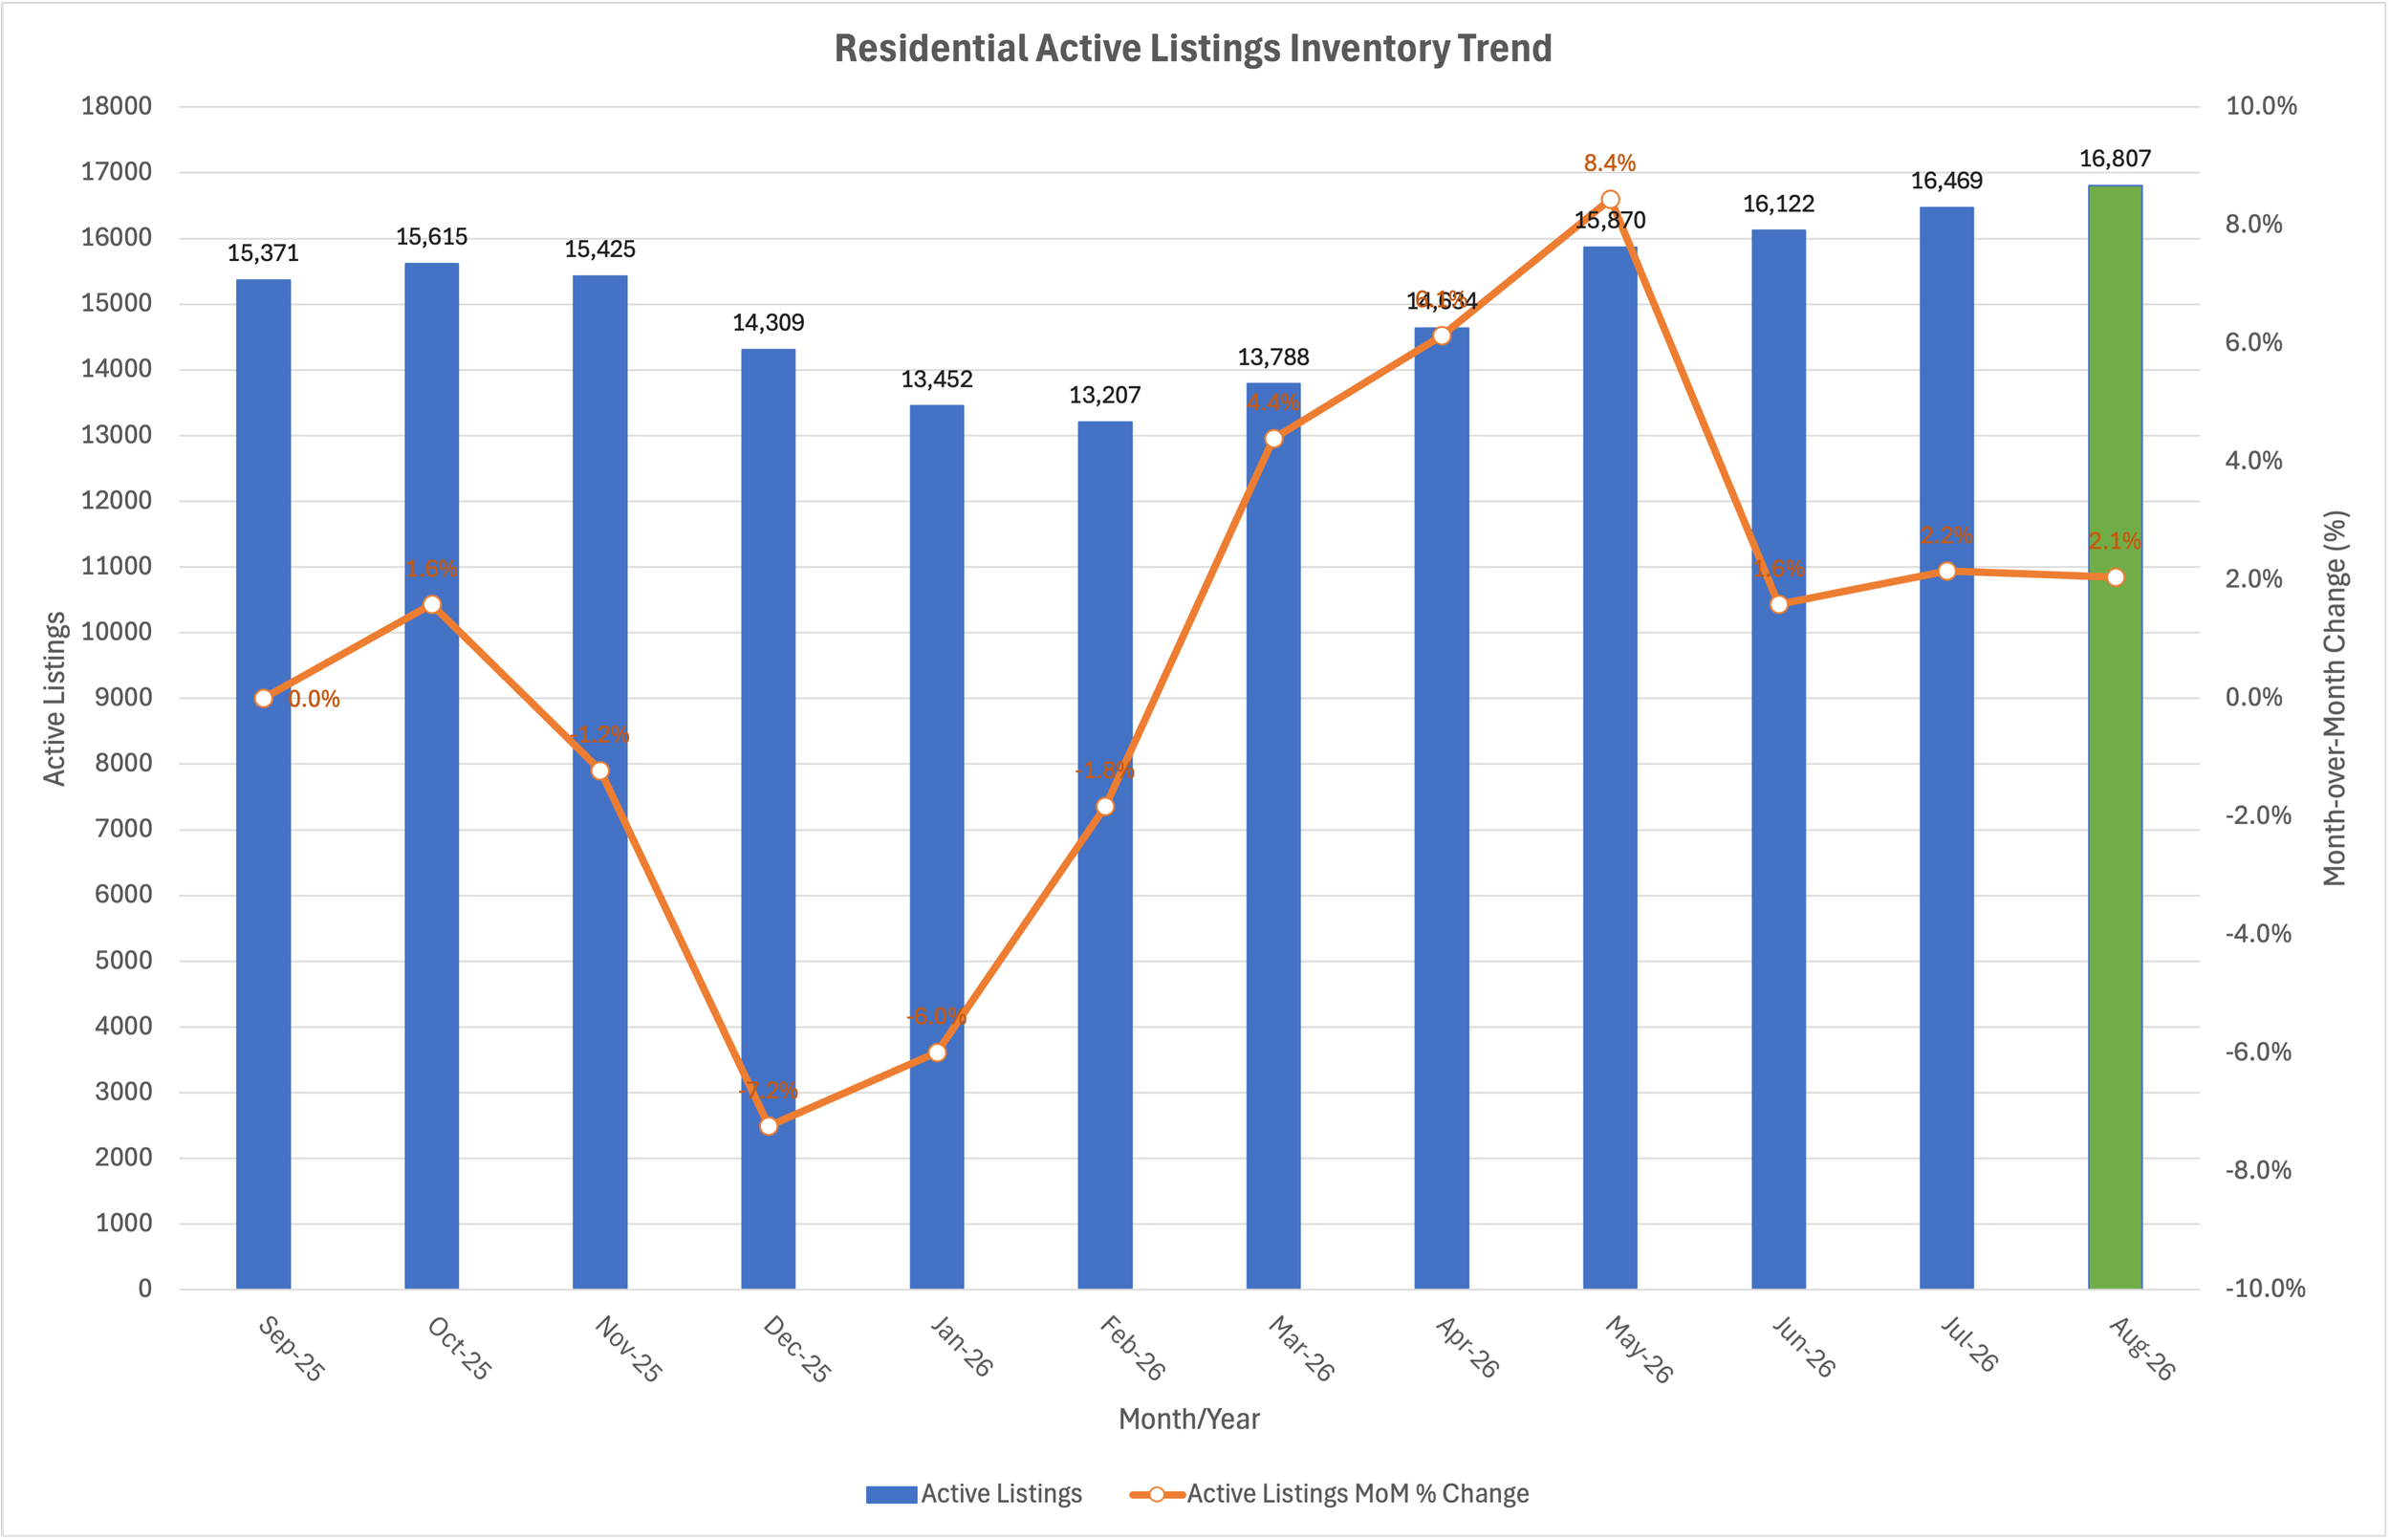
Active listings increased from 15,487 in August 2025 to 16,807 in August 2026, an increase of 8.5%. Year-to-date active-listing activity was also 6.3% higher than in the comparable 2025 period.
The monthly history reinforces the direction of this change. Active listings fell to a 12-month low of 13,207 in February 2026, then increased in every subsequent month to 16,807 in August. That is an increase of approximately 27.3% from February through August, calculated directly from the monthly values. Inventory also increased approximately 24.9% from January’s 13,452 listings to August’s 16,807.
Sold listings did not keep pace with that inventory growth. August 2026 recorded 3,985 sales, down 5.8% from 4,232 in August 2025. This combination, active listings up 8.5% while monthly sales declined 5.8%, is the clearest indication that market balance has shifted toward buyers relative to the prior year.
-
The absorption rate rose from 4.01 in August 2025 to 4.22 in August 2026, a reported increase of 5.24%. The year-to-date rate increased more substantially, from 3.45 to 3.80, or 10.14%. [Market_Sum...__09-48-AM | Excel]
Within the monthly series, absorption reached a low of 3.36 in February 2026 and then increased every month:
March: 3.51
April: 3.71
May: 4.01
June: 4.07
July: 4.12
August: 4.22
The uninterrupted six-month increase is more informative than any single month. It shows that inventory has been accumulating relative to the pace of sales throughout the spring and summer period covered by the file. August’s 4.22 is also the highest absorption rate in the 12-month history provided.
-
Average cumulative days on market, or CDOM, was 66 days in August 2026, compared with 58 days in August 2025, an increase of 13.79%. Median CDOM increased from 30 to 35 days, or 16.67%.
The year-to-date comparison is even more pronounced:
Average CDOM: 68 days versus 58, up 17.24%
Median CDOM: 34 days versus 28, up 21.43%
The monthly history shows a seasonal-looking peak of 86.3 days in February 2026, followed by improvement through June, when average CDOM reached 59.6 days. It then rose to 63.6 days in July and 66.6 days in August. The recent two-month increase suggests that the market began slowing again after its strongest late-spring period.
-
August’s average active list price was $512,313.70, up 1.70% from August 2025. The median active list price was $379,900, up only 0.80%. Year to date, the average active list price rose 3.31%, while the median declined 0.24%.
For closed sales, the August average sale price was $466,570.01, down 0.31% year over year. The median sale price declined more noticeably, from $380,000 to $373,000, or 1.84%. On a year-to-date basis, however, average sale price increased 1.66%, while median sale price declined 0.53%.
This divergence is important. Rising averages combined with flat or declining medians can occur when the mix of transactions includes relatively more higher-priced properties. The workbook supports treating the market as price-stable overall, but it does not support saying that the typical property appreciated meaningfully. Median sale price is slightly lower both for August and year to date.
-
The sale-to-original-list-price ratio reached 97.1% in May 2026, then declined to:
97.0% in June
96.3% in July
96.2% in August
That represents a 0.9 percentage-point decline from May through August. However, August’s 96.2% remained slightly above the 95.9% shown in September through November 2025 and above the January 2026 low of 95.2%.
This is a meaningful but measured change. It suggests negotiating conditions softened after the spring peak, but it does not indicate that sellers are routinely experiencing extreme discounts. It also reinforces the importance of comparing the final sale price with the original list price, not merely the most recent reduced price.
-
New listings reached their 12-month high of 7,246 in April 2026, then declined to 5,526 in August, approximately 23.7% below April. August new listings were essentially unchanged from August 2025, down only 0.1%, while the year-to-date total remained 2.8% higher.
Sales reached their 12-month high of 5,032 in June 2026, then declined to 4,367 in July and 3,985 in August. The June-to-August decline was approximately 20.8%. Despite the weaker August comparison, year-to-date sold listings totaled 32,144, slightly above the 31,977 recorded for the comparable 2025 period, an increase of 0.5%.
Pending listings provide a somewhat better forward-looking signal than August closings alone. August pending activity was 4,166, up 0.5% year over year, and year-to-date pending activity was 2.3% higher. This supports describing demand as restrained rather than absent.
The Story:
Rising Absorption Rate → More inventory relative to sales activity.
Increasing CDOM → Homes taking longer to sell.
