Executive synopsis - October 2026
October 2026’s completed residential report shows a widening contrast between available homes and transaction activity. Active inventory reached a rolling 12-month high of 17,523, up 1.6% from September and 12.0% from a year earlier, while pending listings and closings were both about 14.0% below last October. More homes are available even though fewer new listings are arriving: October’s new-listing count fell 13.2% year over year. That distinction matters more than a simple claim that supply is surging.
The pace indicators reinforce a more measured market. The reported absorption measure reached a rolling high of 4.44, and Average CDOM increased to 73.0 days. Sales averaged 95.5% of original asking price, down from 95.9% in September, but the sale-to-list-price ratio held at 98.3%. These figures suggest softer pricing power relative to original expectations, not a sudden deterioration in every negotiation.
Prices tell two different monthly stories. Average sale price rebounded 2.5% to $461,831, while the median fell 1.6% to $368,995; both remained below last October. The divergence does not establish changing values for individual homes.
Year-to-date closings were down just 1.4%, a much smaller decline than October’s annual comparison. All five price bands had more inventory and fewer sales than a year ago. Taken together, the evidence favors patient, property-specific comparisons—not a blanket market label or a forecast.
-
The reported absorption measure rose to 4.44 from 4.35 in September, up 2.1%, and was 11.3% above last October’s 3.99. It reached a rolling 12-month high after eight consecutive monthly increases. The year-to-date measure was 3.94 versus 3.56, a source-reported increase of 10.7%.
Average cumulative days on market rose to 73.0 from 70.5, a 3.5% monthly increase, and was 14.1% above last October’s 64.0 days. Average DOM edged up to 59.8 from 59.2 days. Both measures increased for four consecutive months. Average CDOM was 22.5% above June’s low of 59.6, but remained 15.4% below February’s high of 86.3.
Median CDOM was 39 days versus 35 a year earlier. Year-to-date Average CDOM was 69 versus 59 days, with a source-reported increase of 17.0%. Together, these measures reinforce the picture of a longer selling process without implying every property follows the average. CDOM and DOM are distinct measures; neither should be treated as a promised timeline. The absorption measure and longer market times support careful planning, not a market label based on one threshold.
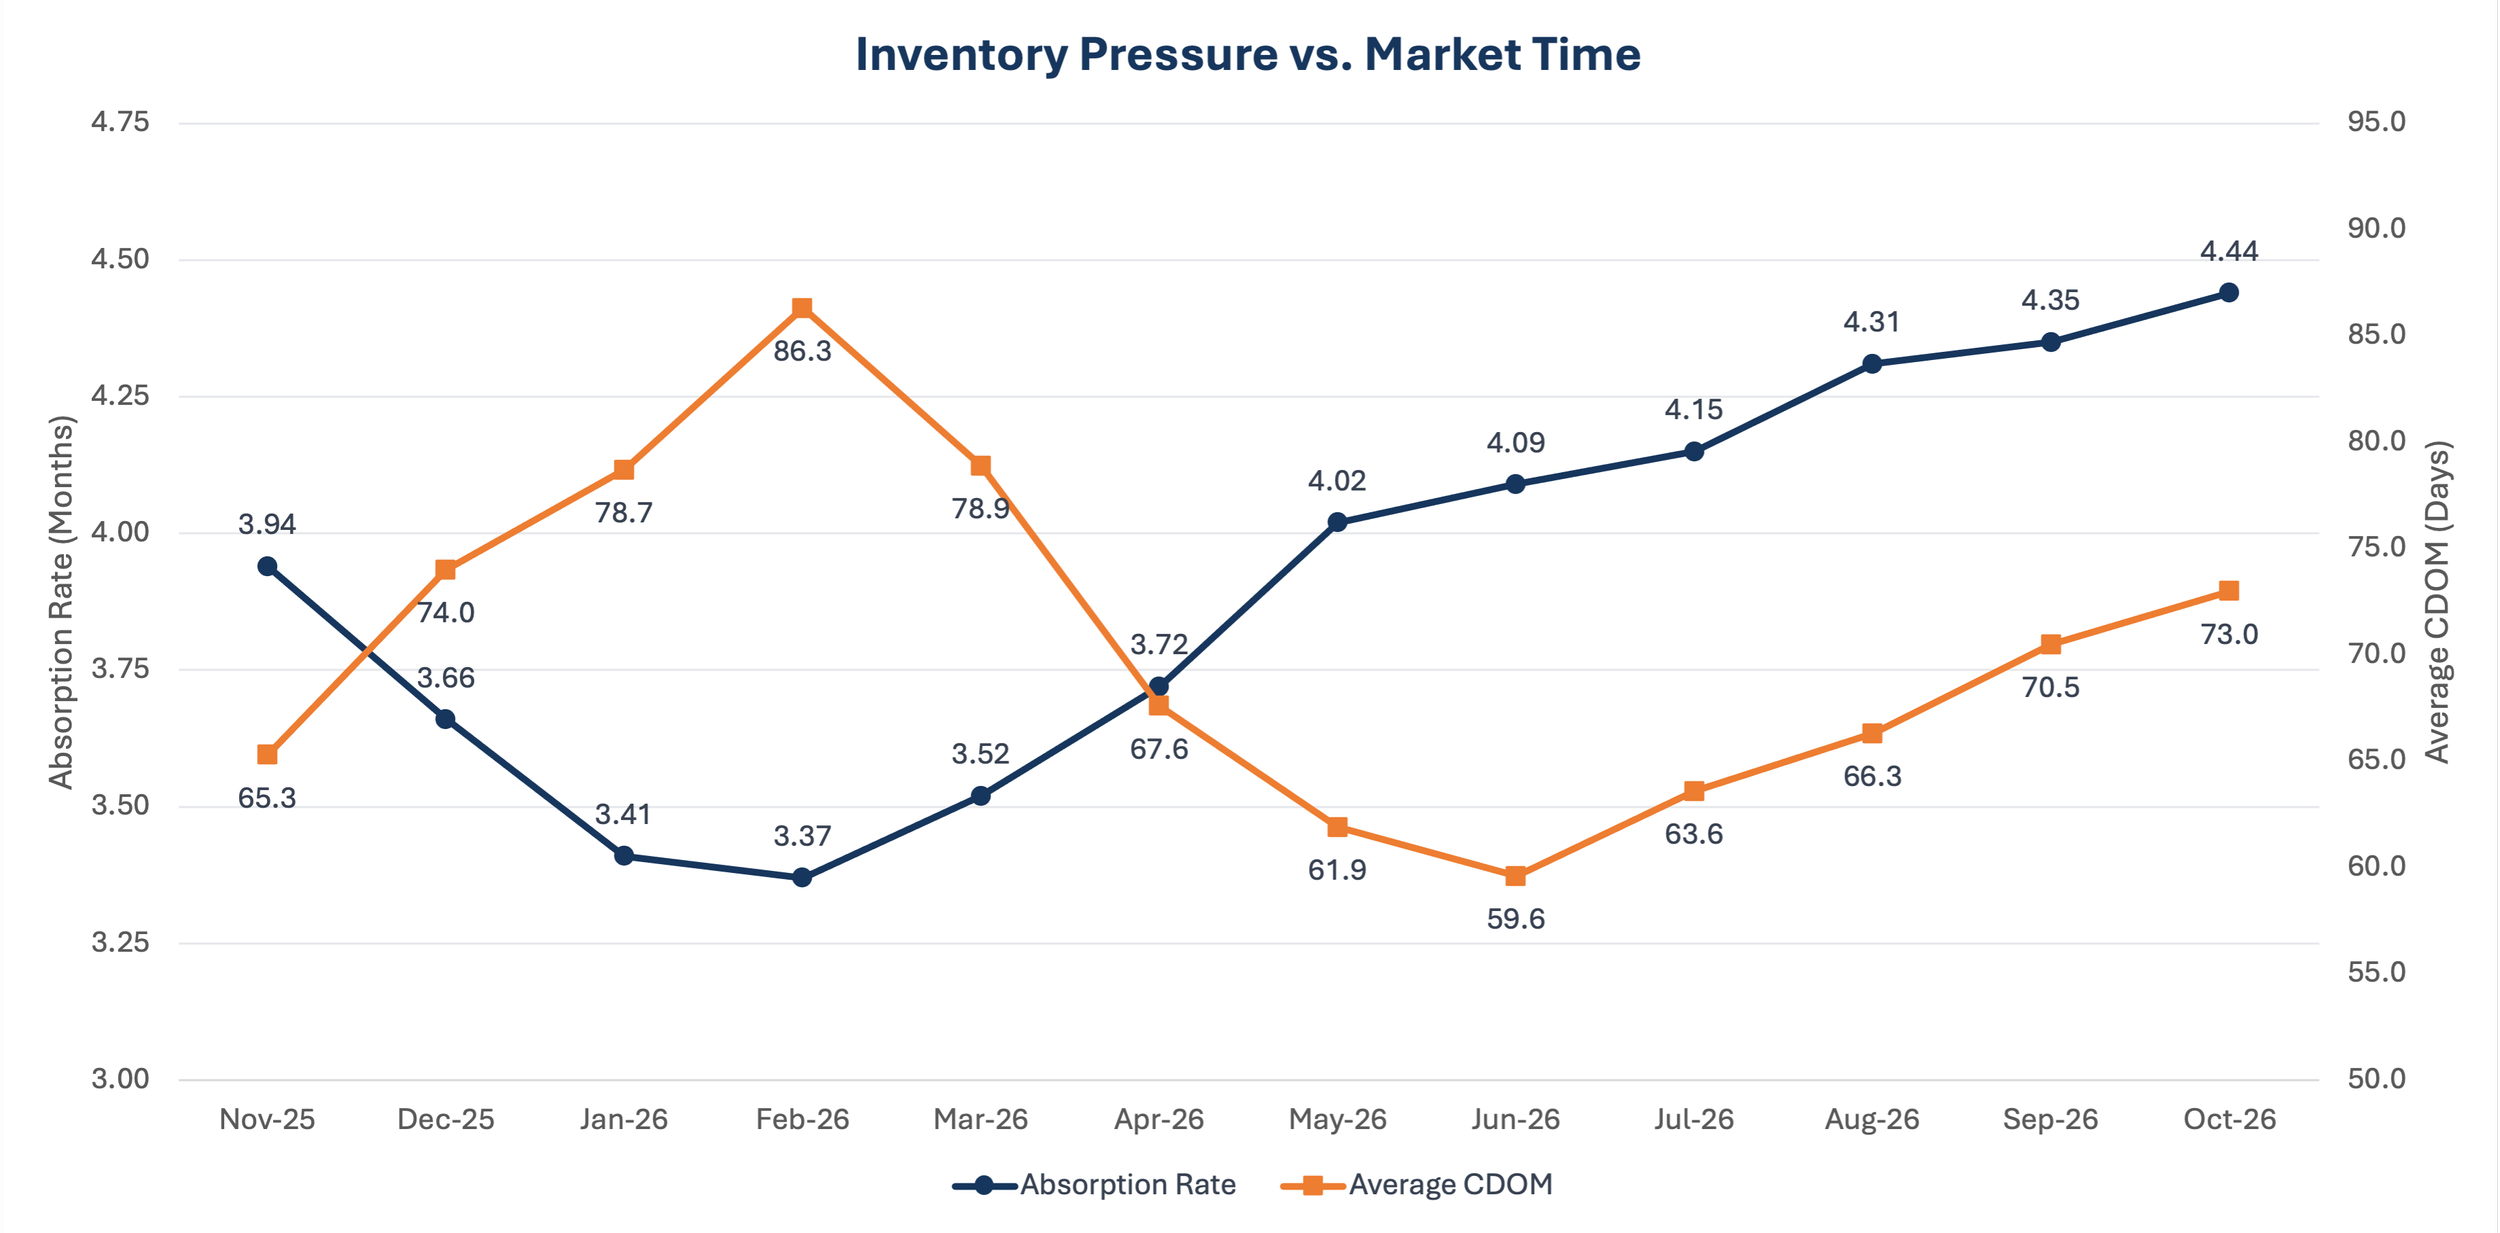
What this shows: October’s absorption measure reached a rolling-year high of 4.44 as average cumulative market time rose to 73 days. Both have increased since June, pointing to a slower selling pace, although market time remains below its winter peak.
-
October sales averaged 95.5% of original list price, compared with 95.9% in September—a decline of 0.4 percentage point. This ratio fell for a fifth consecutive month and was 1.6 percentage points below May’s rolling high of 97.1%. It remained above January’s low of 95.2%, so the decline did not establish a new rolling-year low.
The sale-to-list-price ratio was unchanged at 98.3%, following September’s decline from August’s 98.5%. It sat between the rolling low of 98.1% and high of 98.8%. That stability tempers the softer original-list comparison: the two measures do not show an equally persistent deterioration.
The combination suggests that original pricing expectations deserve scrutiny, especially with more inventory and longer market times. But these aggregate ratios use different asking-price benchmarks; their difference is not a reliable estimate of an individual seller’s price reductions, concessions, or net proceeds. The workbook has no prior-year or year-to-date comparisons for these ratios. For sellers and buyers alike, relevant competing listings and recent comparable sales are the stronger basis for evaluating a specific price.
-
Average sale price rose 2.5% to $461,831 from September’s $450,401, reversing September’s monthly decline. Median sale price fell 1.6% to $368,995 from $375,000, reversing its September increase. The rolling analysis classifies both three-month patterns as mixed, rather than a consistent upward or downward trend.
These results are not contradictory valuations of the same homes. The average reflects the arithmetic mean of sale prices and is more influenced by higher-priced sales; the median is the middle sale price. A change in the mix of completed transactions can move them differently, but this workbook does not establish what caused October’s divergence or measure same-home appreciation.
Both measures were below last October: the average was down 0.4% from $463,576, and the median was down 1.6% from $375,000. Neither set a rolling-year extreme. They remained 5.2% and 5.4%, respectively, below June’s highs of $486,971 and $389,900, and above January’s lows of $433,888 and $352,500.
Year-to-date average sale price was $461,728 versus $455,427, up a source-reported 1.4%, while the YTD median was unchanged at $375,000. Current active asking prices describe a different group: the average was $504,286, down 5.8% annually, and the median was $375,000, down 1.1%. Neither asking prices nor aggregate sold-price changes establish how an individual home’s value has changed.
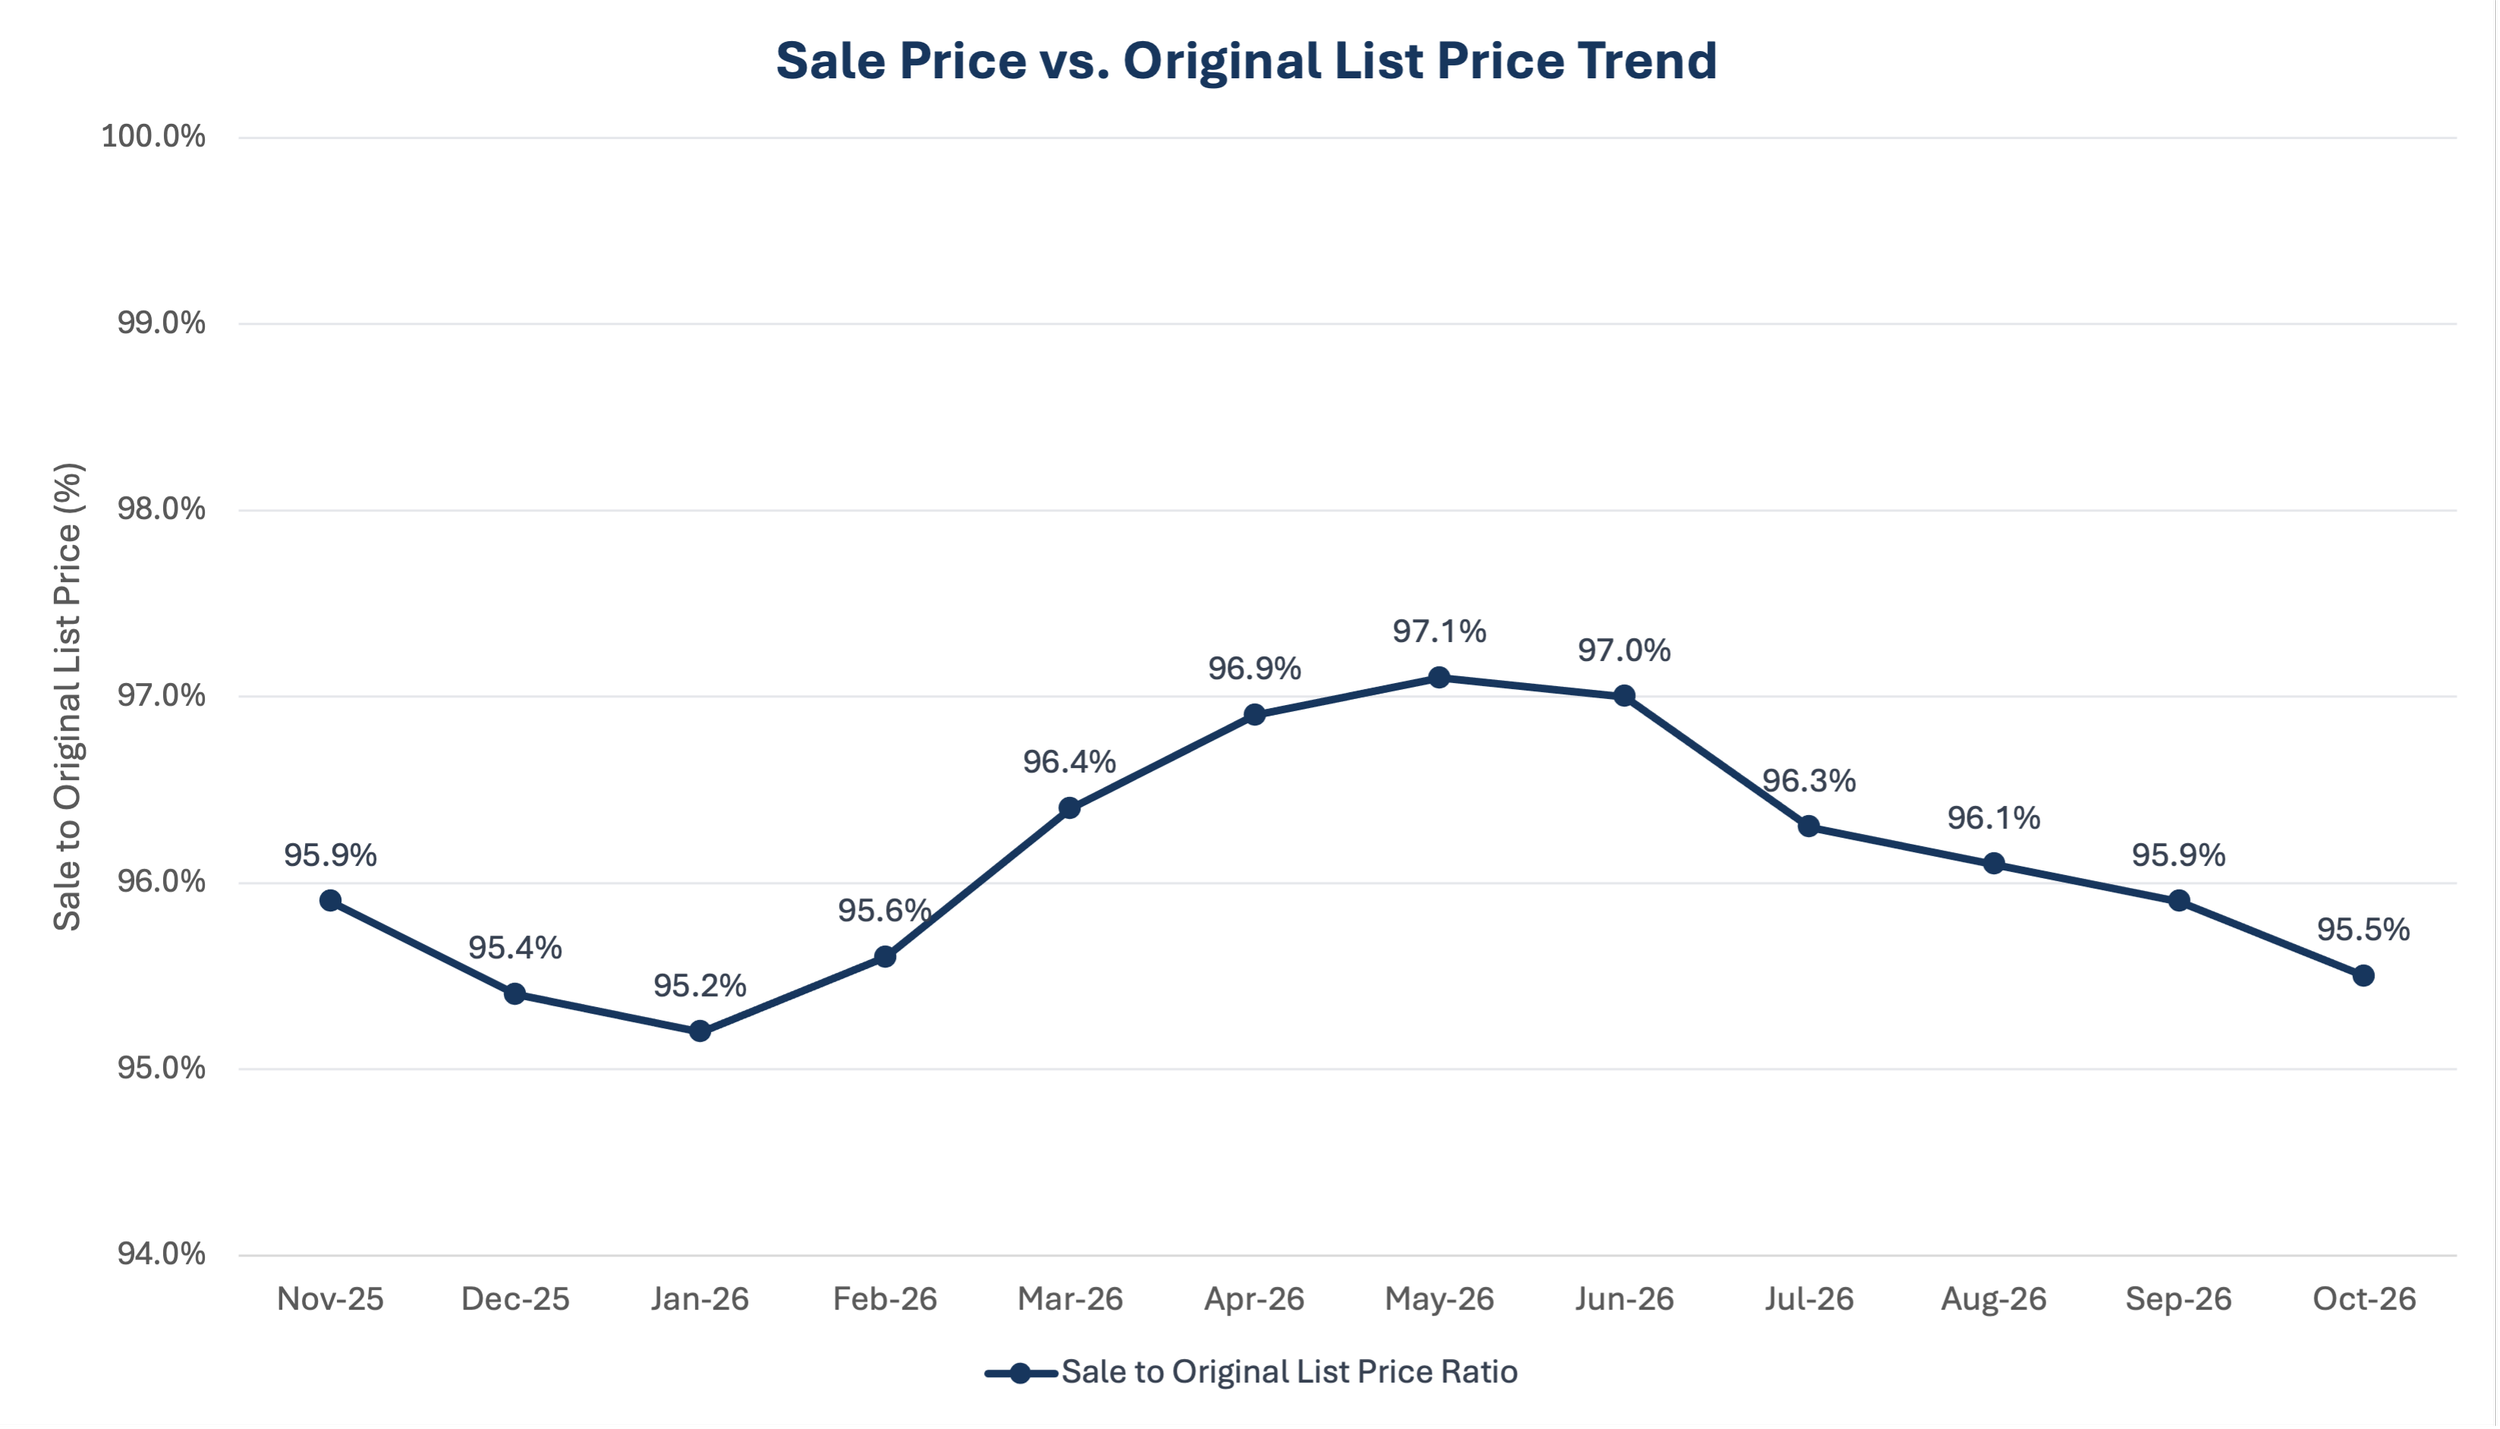
What this shows: October sales averaged 95.5% of original asking price after five consecutive monthly declines, below May’s rolling-year high of 97.1%. This sustained easing suggests softer seller pricing power relative to initial expectations, not a sudden collapse.
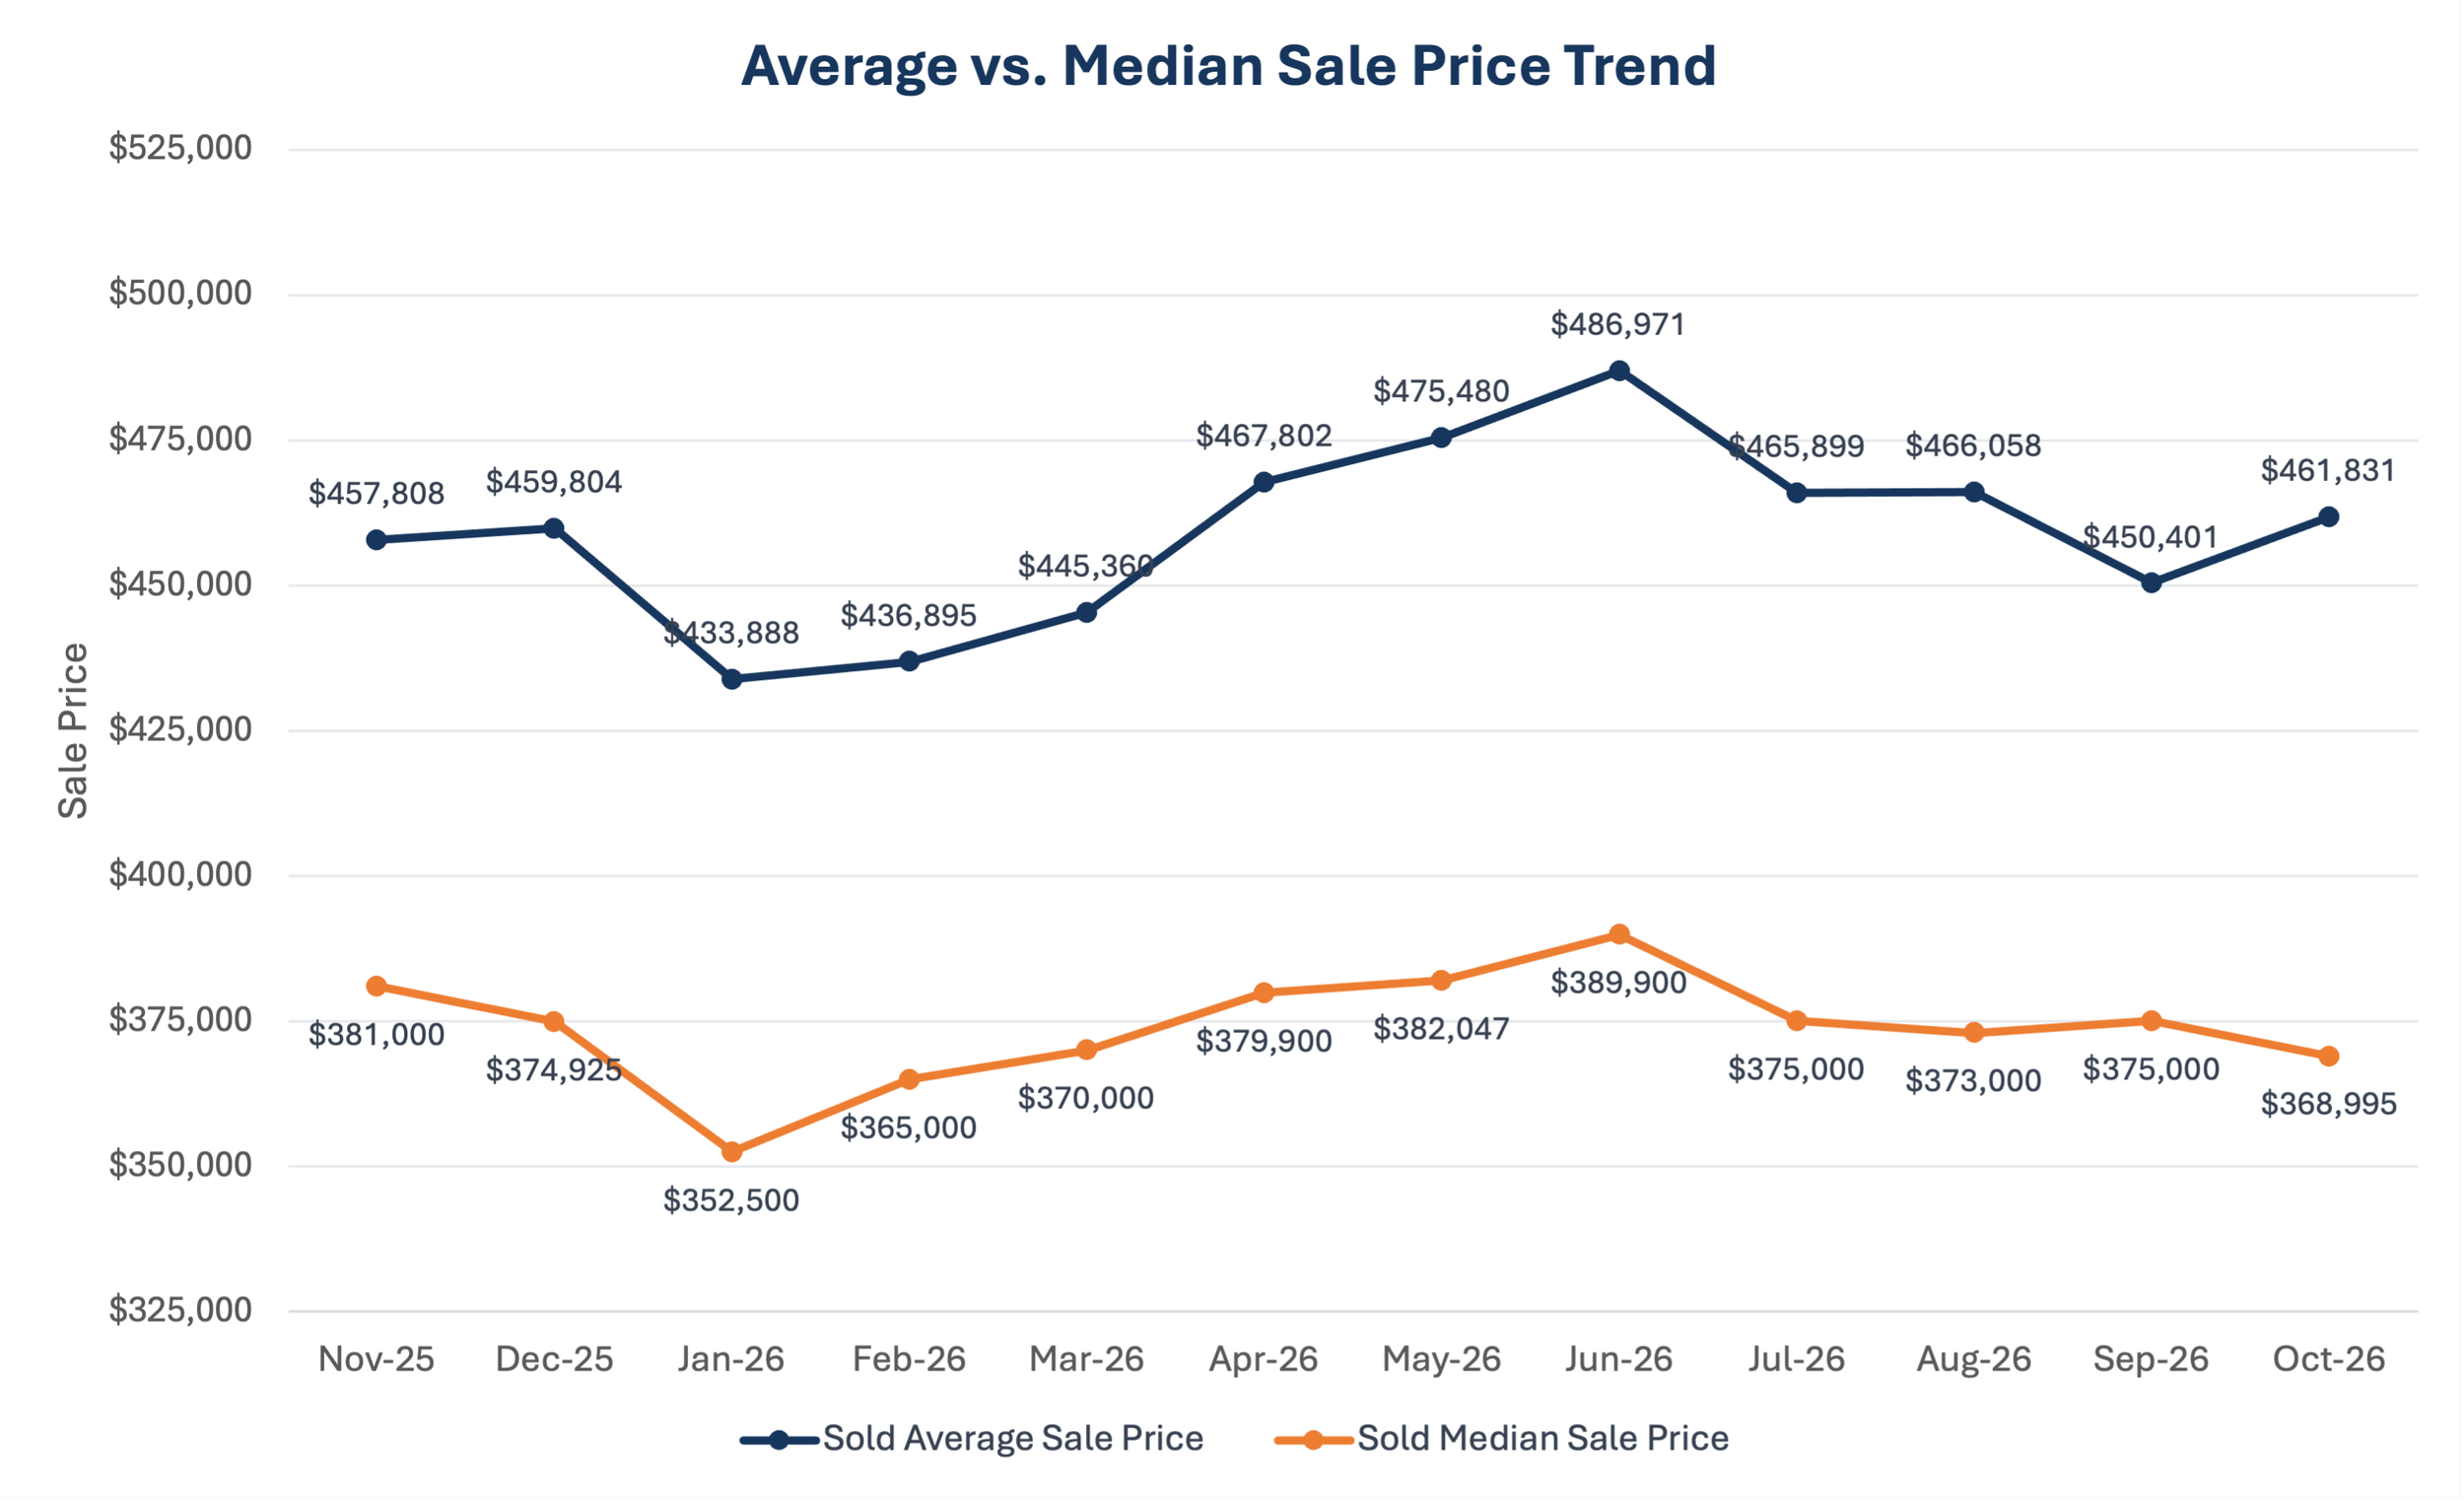
What this shows: October’s average sale price rose 2.5% while the median fell 1.6%, with both below June’s rolling-year highs. Their differing directions may reflect a changing mix of sales, rather than appreciation or depreciation of individual homes.
-
All five consolidated price bands had more active listings and fewer closings than last October. Under $200,000, inventory rose 21.9% to 1,341 while sales fell 16.0% to 257. At $200,000–$299,999, inventory increased 14.4% to 3,673 and sales declined 9.8% to 760. The lowest band had the largest inventory increase; the next band had the smallest sales decline.
At $300,000–$399,999, inventory rose 10.0% to 4,977 while sales fell 13.0% to 920. At $400,000–$499,999, inventory rose 14.3% to 2,883 and sales declined 13.7% to 527. At $500,000+, inventory increased 8.5% to 4,649 while closings fell 17.7% to 950—the largest sales decline among these bands. The $300,000–$399,999 band held the most inventory, but $500,000+ recorded the most closings; inventory and sales do not rank identically.
Pending activity was also lower in every band: 272 versus 279 under $200,000; 783 versus 825 at $200,000–$299,999; 914 versus 1,002 at $300,000–$399,999; 505 versus 653 at $400,000–$499,999; and 864 versus 1,121 at $500,000+. The larger upper-band shortfalls add context to those segments’ closing declines, without establishing future sales outcomes.
The active-to-monthly-sold count ratio ranged from 4.83× at $200,000–$299,999 to 5.47× at $400,000–$499,999. This is not months of supply or a forecast of selling time. The broad inventory-versus-sales contrast holds across bands, but its intensity differs. These consolidated categories are more useful than dramatic percentage changes in tiny source categories, and property-level comparisons are still essential.
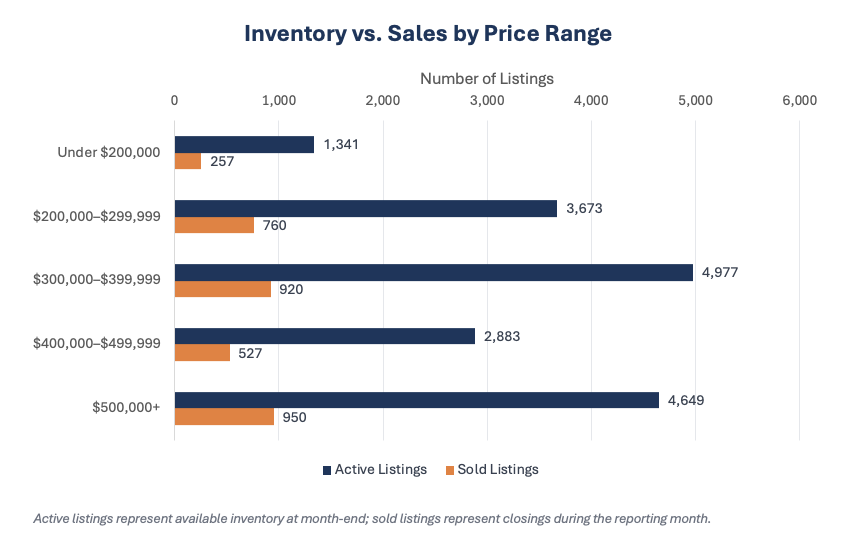
What this shows: In October, the $300,000–$399,999 band led inventory with 4,977 listings, while $500,000+ led closings with 950 sales. These two bands dominate both measures, but their different rankings show that available homes and completed sales are not distributed identically.
What This Means
For Buyers
October offers more homes to compare than a year ago, while pending activity and closings are lower and market times have lengthened. That supports taking a thoughtful look at competing properties, condition, and recent comparable sales—not assuming every seller will negotiate the same way.
Average sale price rose during the month while the median fell. Neither result tells you what a particular home is worth or where prices go next. Compare alternatives within your price range and priorities, and keep affordability, inspection findings, and the terms of an individual transaction separate from broad market averages.
For Sellers
More competing inventory, longer market times, and a lower sale-to-original-list-price ratio make realistic pricing and a clear comparison with available alternatives especially important. The sale-to-list-price ratio held steady, however, so the evidence does not support a claim that every negotiation suddenly became more difficult.
All five price bands had fewer sales than last October, but the size of the decline varied. Review comparable closed sales, competing listings, condition, and presentation within your own segment. Plan for a range of possible marketing timelines rather than treating the average as a deadline or the aggregate price figures as a prescribed adjustment.
Ready to talk about what this market means for you?
Whether you're considering buying, selling, or simply planning ahead, All About U Real Estate can help you put the market data into the context of your property, neighborhood, and goals.
Data Source: Doorify MLS / Flexmls Market Summary. Statistics reflect MLS data available when this report was prepared. Historical figures may be revised as underlying MLS records are updated.
At a Glance Summary:
Inventory: More homes to compare. Available inventory is up 12.0% from last October and at a rolling-year high, despite fewer new listings.
Market Time: Allow for a measured pace. Average cumulative time on market rose to 73.0 days, but remains below February’s peak.
Seller Pricing Power: Original asking prices face more pressure. Sales averaged 95.5% of original list price, while the sale-to-list ratio held steady at 98.3%.
Home Prices: The monthly signals split. Average sale price rose 2.5%, but the median fell 1.6%; neither measures the value change of an individual home.
Wondering what these trends mean for your home or your plans?
Market statistics provide important context, but every property and neighborhood is different. Contact All About U Real Estate to discuss how today’s market conditions may relate to your specific goals.
Explore the Data
Take a closer look at the trends shaping today’s residential market.
-
Active inventory reached 17,523 in October, up 275 homes, or 1.6%, from September’s 17,248. It was 12.0% above last October’s 15,643 and marked the eighth consecutive monthly increase. Inventory stood 32.5% above February’s low of 13,222, making October the high for the November 2025–October 2026 rolling window.
Closings moved in the opposite direction: 3,414 homes sold, down 8.8% from September’s 3,744 and 14.0% from last October’s 3,971. The annual inventory growth rate exceeded the annual sales growth rate by 26.0 percentage points. That is a contrast between more standing inventory and less completed activity, not a measure of how long any particular home will take to sell.
The inventory increase was larger than September’s 0.5% monthly gain, but a 1.6% change is not a sudden surge. For homeowners, the useful implication is a larger pool of competing listings alongside a quieter closing pace. Individual location, condition, and price comparisons remain more informative than a market-wide negotiating label.
-
October brought 4,982 new listings, down 8.1% from September’s 5,422 and 13.2% from last October’s 5,740. New-listing activity declined for a sixth consecutive month and was 31.3% below April’s rolling high of 7,255. It was not a rolling-year low: December’s count was 3,160.
The year-to-date comparison is milder. New listings totaled 59,450 versus 58,586, an increase of 1.5%. More listings have entered the market across the year even though October’s inflow was lower both monthly and annually. These comparisons describe different time horizons and should not be collapsed into one trend.
Available inventory still rose during October. Inventory is the stock of homes available, while new listings are an inflow; they need not move together. The workbook does not isolate every reason listings remain available or leave the market. For consumers, more choice today should not be mistaken for evidence that owners suddenly accelerated listing activity.
-
Pended listings totaled 3,338, down 4.5% from September’s 3,494 and 14.0% from last October’s 3,880. This was the seventh consecutive monthly decline and left pending activity 34.0% below March’s rolling high of 5,058. The monthly decrease was smaller than September’s 11.3% drop, but activity had not turned upward.
Closings also continued lower, falling for a fourth consecutive month to 3,414. That was 32.3% below June’s high of 5,041, although still above January’s low of 2,595. Pending activity likewise remained above its December low of 2,755. Both series show a sustained retreat from their spring or summer highs, not new rolling-year lows.
Year-to-date pending listings were 41,107 versus 41,518, down 1.0%; closings were 39,420 versus 39,964, down 1.4%. Those modest cumulative declines put October’s roughly 14.0% annual declines in perspective. Pending counts provide context for the transaction pipeline, but the data does not establish which contracts will close or when. The monthly series is not seasonally adjusted, so the recent declines alone do not prove a lasting shift in underlying demand.
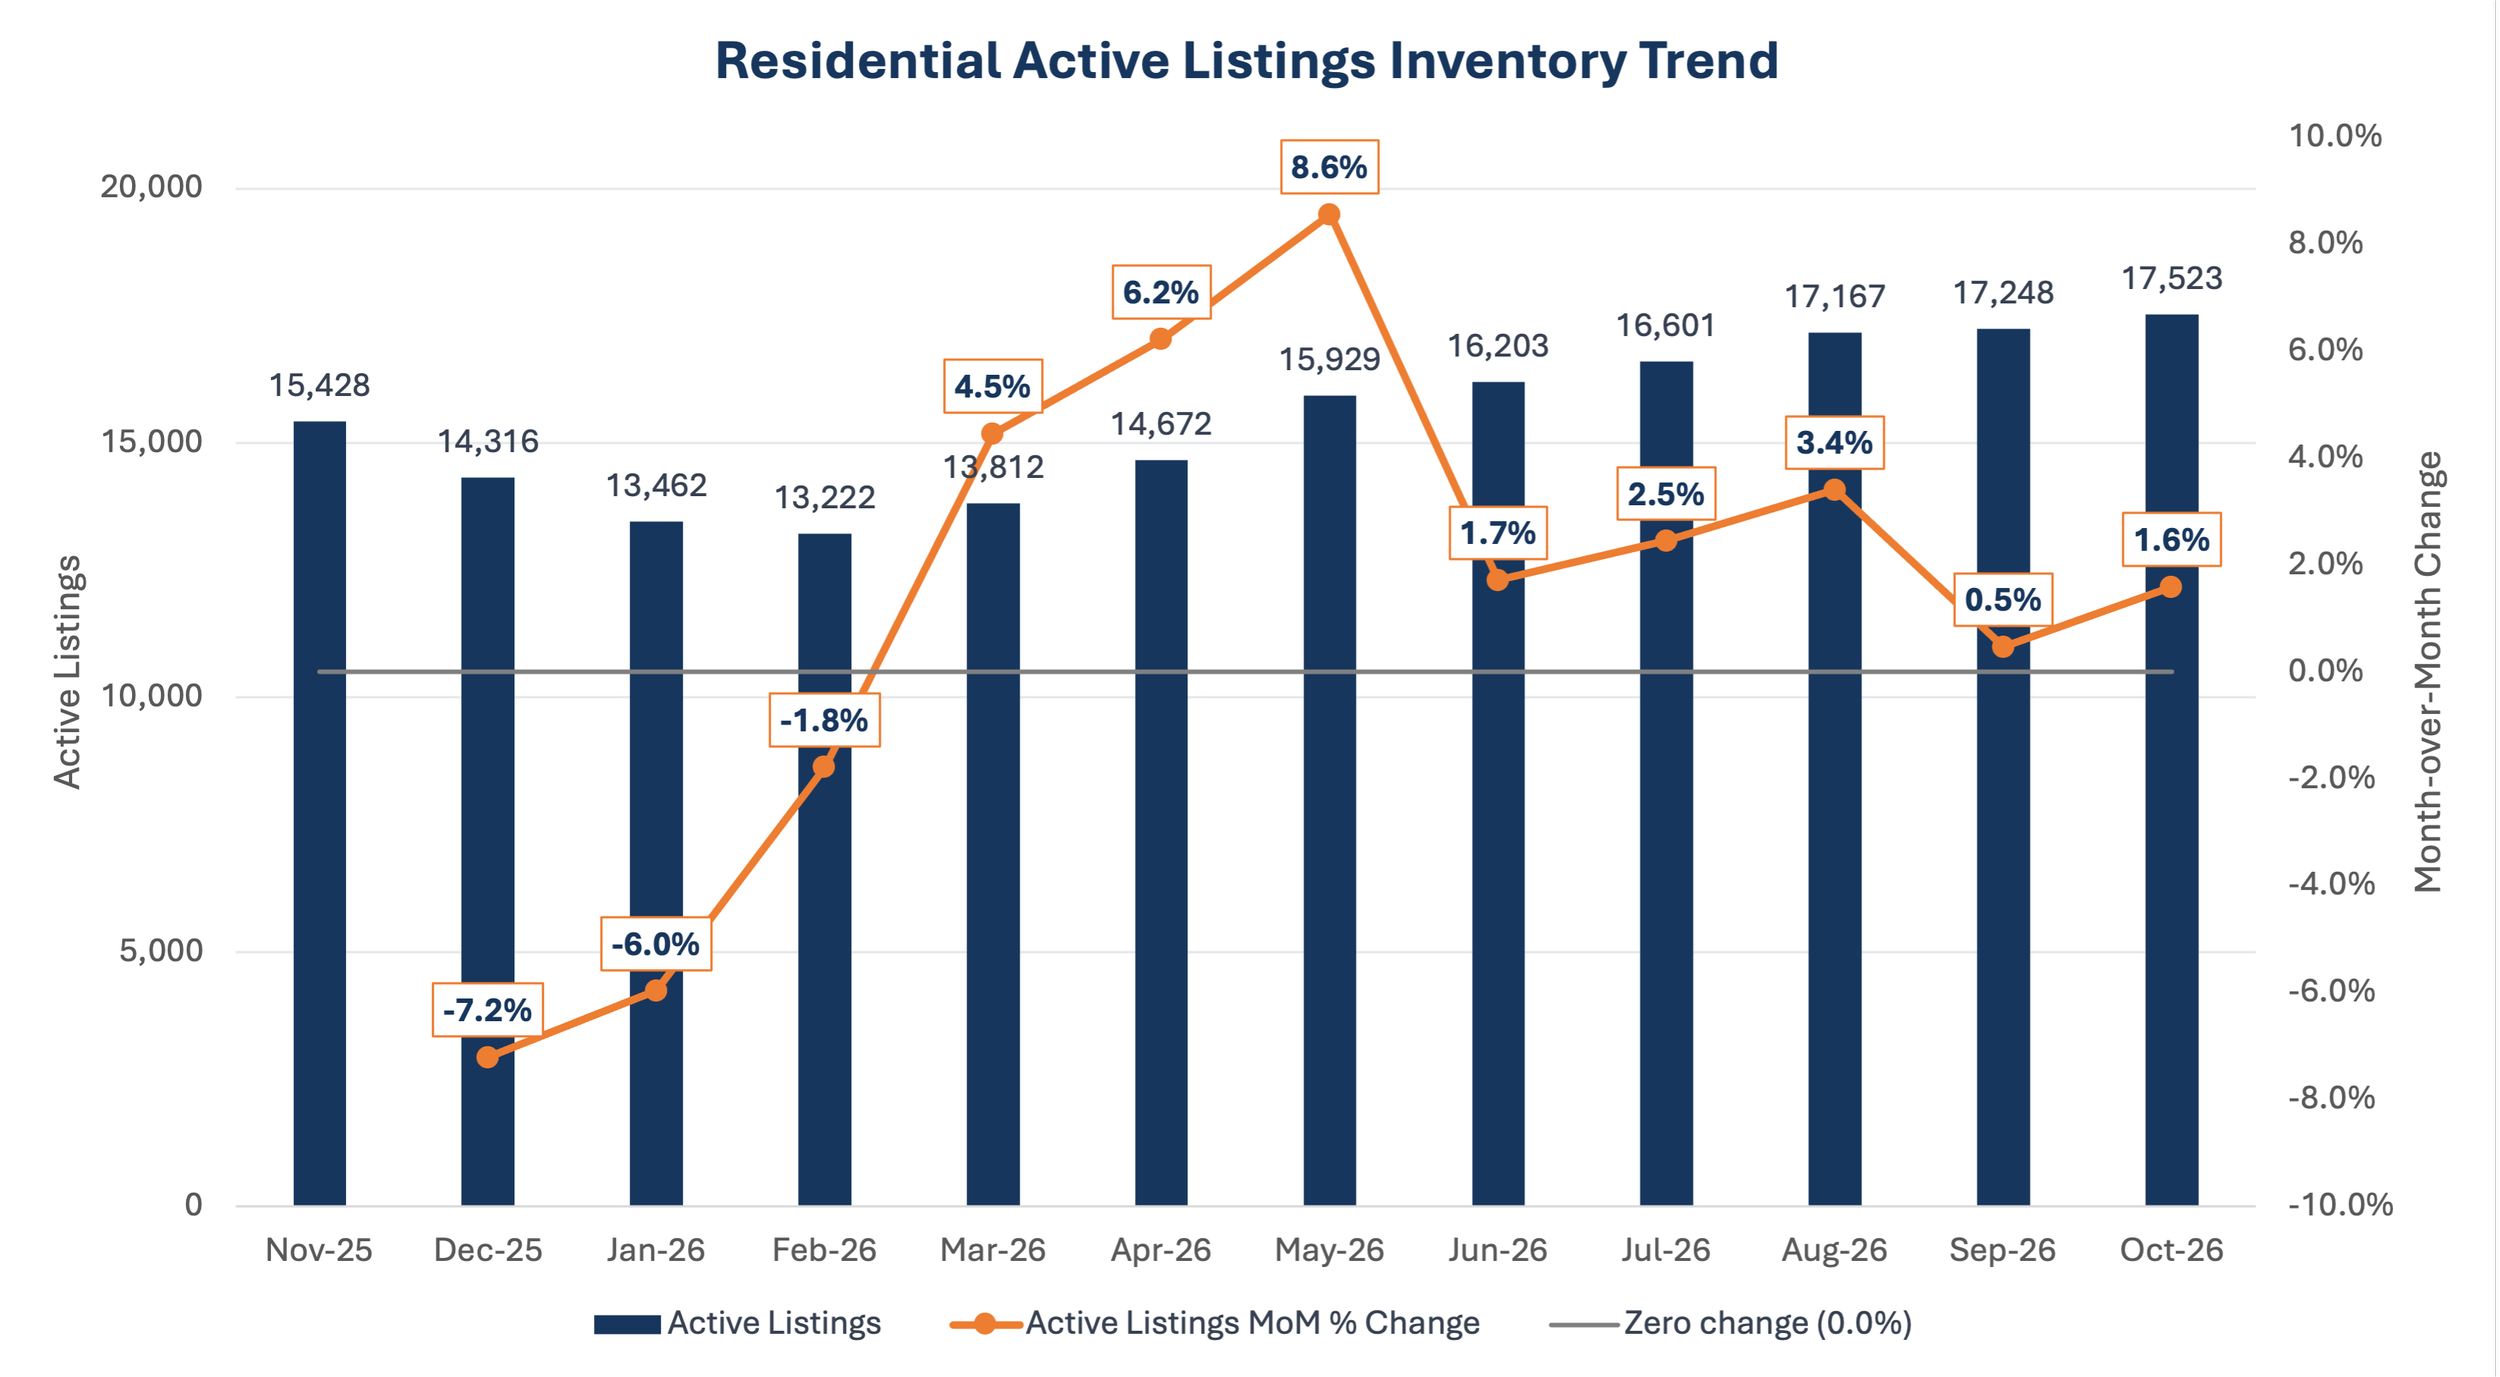
What this shows: After falling to February’s low, inventory climbed to a rolling-year high of 17,523 in October 2026. Monthly growth picked up from September to 1.6%, extending the rise rather than reversing it, but not signaling a sudden surge.
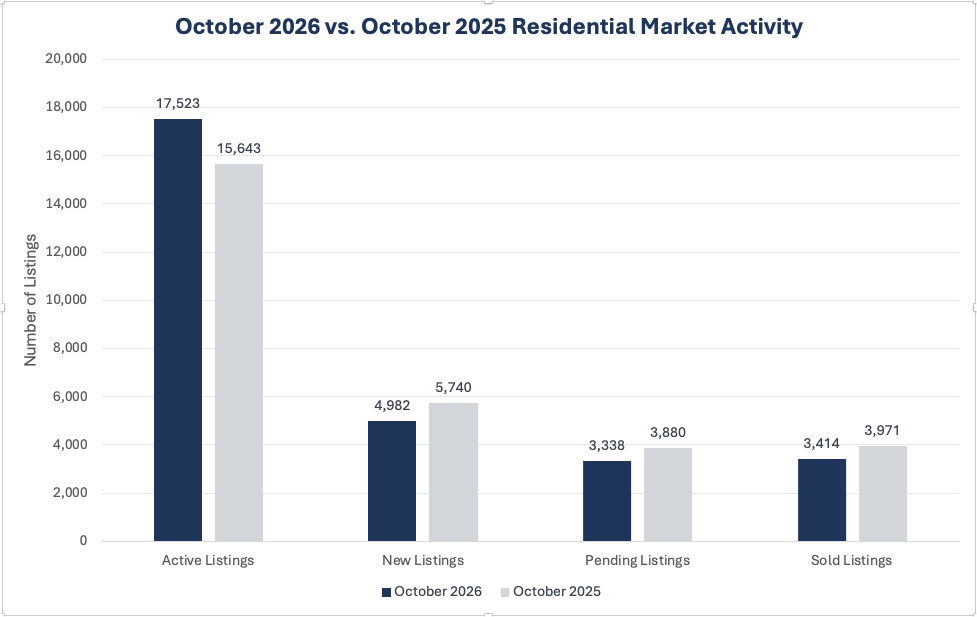
What this shows: October inventory was 12.0% higher than a year earlier, while pending activity and closings were each about 14.0% lower. New listings also declined, highlighting more homes available alongside fewer transactions—not a rush of incoming listings.